GoFiler Legato Script Reference
Legato v 1.6f Application v 6.4a
|
| Table of Contents | < < Previous | Next >> |
Chapter Two — Language Overview (continued)
2.6 Integrated Development Environment (IDE)
Certain applications will contain an Integrated Development Environment or IDE. While Legato scripts can be run in any enabled application, the IDE aids in the development of programs.
When a file with a .ls or .ms extension is opened or created, the IDE editor will open. This is a version of the Text View/Code view editor with additional script functionality. While the editor can also aid in developing PHP and JavaScript, the debugging is designed specifically for Legato.
Much like most other IDEs, Legato scripts can be developed in the text editor. When a Legato script is executed from the IDE, it can be stopped by processing the Ctrl+Break quick key. When a program is “run” without any debugging options, the IDE’s ribbon and other activities are suspended (with the exception of background tasks). In debug mode, most functions will operate when script execution is suspended.
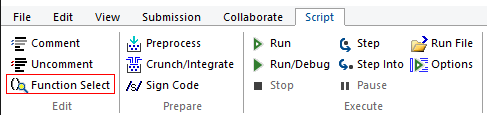
During editing, the Function Select function (F6) provides for a quick method to search for functions:
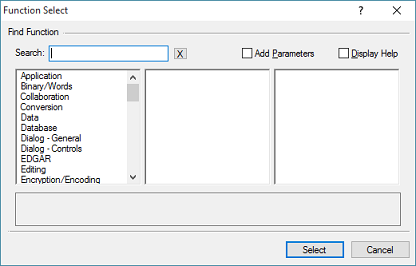
The selection dialog will appear:
Functions can be selected by clicking through groups:
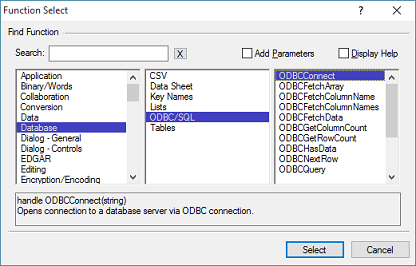
Some functions are located in multiple groups when it is applicable. Another approach to finding a specific function is to type a search term into the Search field:
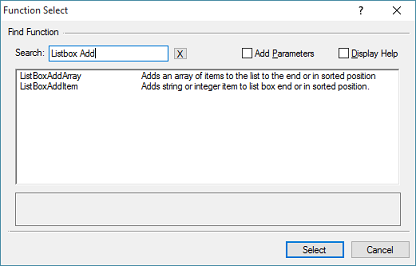
Clicking on a function in the results will display the short information in the lower box (as shown in the previous figure). If the Display Help box is checked, the help system is opened (if not already open) and the currently selected function’s documentation is displayed. This makes it easy to quickly review the details of functions.
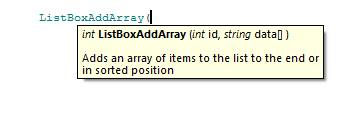
The Add Parameters function adds the parameter prototype when the function is inserted into the code. This can sometimes be useful in selecting parameters. When a ‘(’ is typed after the function name in the editor, popup help will also be displayed:
The Preprocess function precompiles a script. This is useful to test whether a script will run without executing the code. It performs all the processing to ready a script for execution including basic syntax checking, including files and symbol resolution.
The function is available from the ribbon as Script | Prepare | Preprocess.
If errors are found during the preprocess, the function is stopped and the errors reported in the Information View.
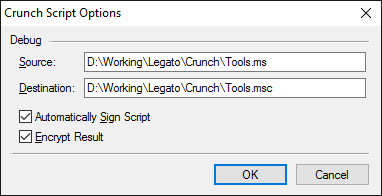
A function has been added to “crunch” code. This IDE function is also available as a script function within the IDE. The function is available from the ribbon as Script | Prepare | Crunch Integrate. The dialog appears as follows:
The function removes comments, combines all included information into a single file and optionally signs and encrypts the file. With this change, a new file type has been added, FT_LEGATO_C, which indicates a crunched and encrypted script. Conventionally, .lsc and .msc extensions can be used to indicate a binary version of a script. However, the content of the script is examined by the script engine to determine whether to process it as binary.
The dialog fields are as follows:
Source — The source file. By default, it is the currently open and selected file within the IDE. If the currently open file is selected, it should be saved prior to running this function.
Destination — The destination filename. It cannot be the active IDE file. It can however be the same name as the source.
Automatically Sign Script — When checked, the script is signed with the default code signing certificate. Note that an incoming signature will be removed.
Encrypt Result — When checked, the content is encrypted to prevent interlopers from viewing the source code.
If errors are found during the preprocess, the function is stopped and the errors reported in the Information View.
Code can be signed with the default Code Signing Certificate, if installed on the system. Signing can be open text or applied to a crunched script.
A program can be run from the IDE using ribbon commands or quick keys. These are as follows:
F5 — Run program in debug mode
F7 — Run program
F9 — Toggle breakpoint at the current caret position
F10 — Step to next statement and execute any functions
F11 — Step to the next statement and step into the next (any) function
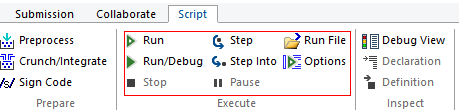
These commands are also on the ribbon:
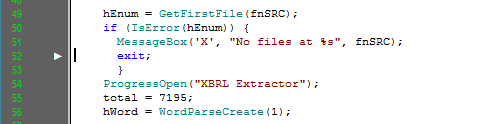
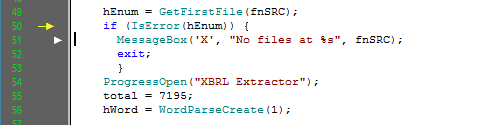
During debugging, the line to be executed next is marked in the sidebar (the sidebar must be displayed):
When a breakpoint has been set, it will appear as a yellow arrow:
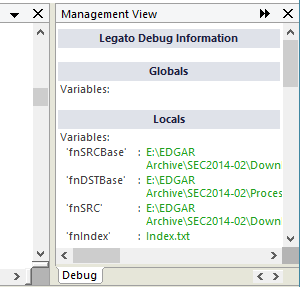
Debug information can be displayed by pressing the Debug View button on the ribbon:
When a script is run, a log is created for its execution, including basic information, warnings, and errors. If enabled or the script contains errors, the log will automatically be displayed in the in the IDE:
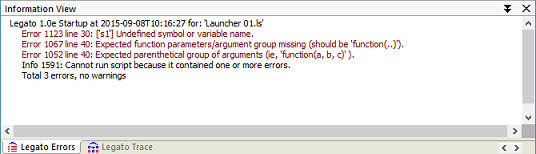
Errors are formatted with a code, offending line (in the original file), an optional item, and finally the description of the error. If the file is untitled, the log does not link back to the source. If titled, double-clicking on the item will bring the editor within proximity of the error. Note that many errors will stop the script engine from processing further and detecting further errors. In this case, correcting errors is an iterative process. Also, since line endings are generally irrelevant, it is possible to have an error reported at a position, but that error is actually caused earlier in the program. For example, neglecting to end a statement with a semicolon can result in an error in the next line since it will be considered part of the previous statement. In addition, the line of code causing an error can be influenced by the lines of code and functions preceding it. For example, passing a bad handle to a function may cause that function to fail and create an error, but the bad handle may have been obtained well before the function in question executes. For more information on error types, see section 2.6.4.
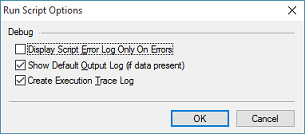
Depending on the options, the error log will not be displayed:
Handling errors in a program hook can be a bit more complex. When a script is run from the command line, the errors may or may not be dumped to the default console. If the console version of Legato is run, the error log appears directly in the console. When running a windows version, the errors appear in the program log, which is usually located in the application data area for the user.
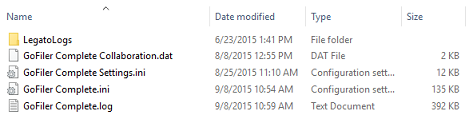
Hook errors can be captured by adding a folder, “LegatoLogs”, within the application data folder for the user (normally at the location “%appdata%\Novaworks”). Legato will automatically write an XML log file using the current tick count and the extension “.log”. The file is transitory since a message posted to it is immediately displayed and the file deleted. If the folder is not present, the log is essentially lost on each execution. When present, a log will be displayed after the hook failure and errors can be corrected. The act of saving the file containing the hook(s) will force script to reload the next time the hook is requested. An example of the folder:
During application startup, many applications will run scripts and extensions. If an error occurs during startup, a message box will be displayed:
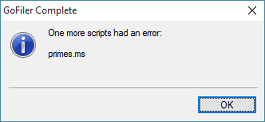
The script must be manually opened and debugged to locate the error.
From the command line, errors look like this:
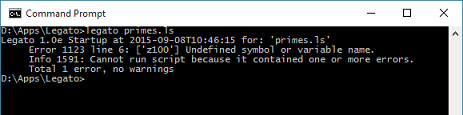
The source file can be manually edited in the application or any text editor.
The Program Trace log allows the last 100 lines of code executed to be displayed in a flow trace format:
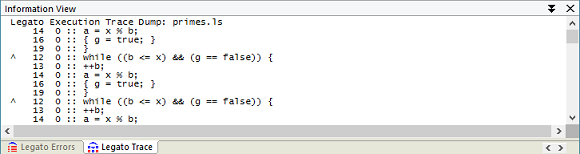
Each line executed is added to the trace log. When the trace exceeds 100 lines, the oldest lines are discarded. When the code jumps back, the ^ character is added to the line. This can also be useful in debugging a script.
Page revised 2026-01-05
| Table of Contents | < < Previous | Next >> |
© 2012-2025 Novaworks, LLC. All rights reserved worldwide. Unauthorized use, duplication or transmission is prohibited by law. Portions of the software are protected by US Patents 10,095,672, 10,706,221 and 11,210,456. Novaworks, GoFiler™ and Legato™ are registered trademarks of Novaworks, LLC. EDGAR® is a federally registered trademark of the U.S. Securities and Exchange Commission. Novaworks is not affiliated with or approved by the U.S. Securities and Exchange Commission. All other trademarks are the property of their respective owners. Use of the features specified in this language are subject to terms, conditions and limitations of the Software License Agreement.