GoFiler Legato Script Reference
Legato v 1.6f Application v 6.4a
|
| Table of Contents | < < Previous | Next >> |
Chapter Two — Language Overview (continued)
There are two code execution trace methods: IDE program trace and file trace. The first is an option discussed briefly in the previous section while the latter will be discussed below. The program trace is meant to provide a basic ‘where have I been’ for the last 100 lines of execution. This can be useful to look at termination and other items of interest in the IDE. However, it requires that the IDE be used to run the script. This is not always practical, particularly when working with hooks, background or scripts running on a command line basis. The file trace is similar but dumps the contents to a default file or to a specified location.
Program tract is integrated with the IDE and is very fast and does not interface with the execution of the program. Essentially, as the script engine is running, a buffer is updated for each line and wrapped and overwritten after 100 lines. Upon completion of the program, the ‘Legato Trace’ tab is displayed:
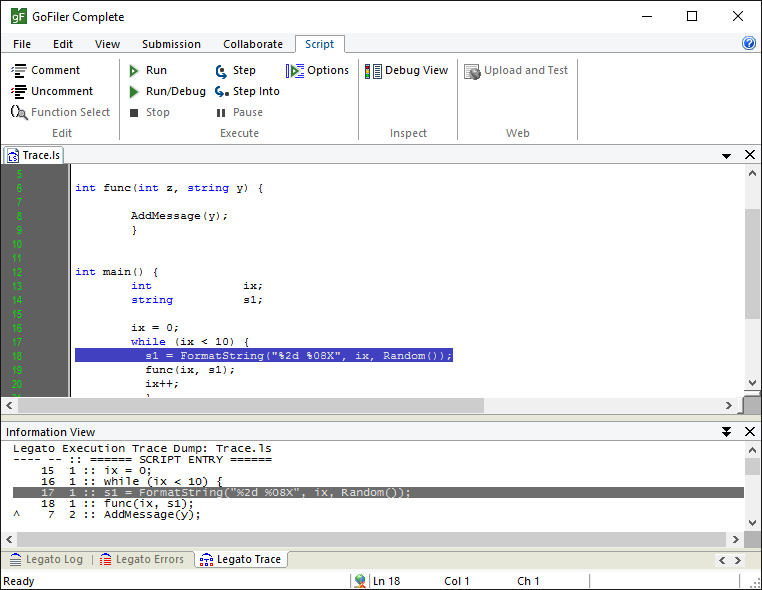
The window contains three fields: the first is a back marker ‘^’ indicating that the program skipped back lines, such as from a loop or a call to a function closer to the top of the file. The next value is the line number followed by the stack position. If multiple statements are present, the line number will appear to not change and line text will be repeated.
Clicking on the entry will highlight the line of the program within the Code View editor.
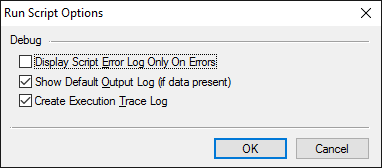
To enable the program trace, select Script | Execute| Options from the ribbon and the following dialog will appear:
File trace is not integrated with the IDE but rather is a built-in feature of the script engine. To enable the file trace, a pragma statement is added anywhere in the code (it can be in an include file):
#pragma DebugTrace [robust]
or
#pragma DebugTrace [robust] name
In the first example, the resulting trace file will be placed into the “LegatoLogs” folder within the “%appdata%” area. This folder must be created to use the function and will normally be located in the user’s profile section. Typing in “%appdata%” as file path in the Explorer address bar will direct Explorer to that location. The folder should be added to the vendor location, normally “Novaworks”. When a filename is not provided, the script name is used as a based filename with the suffix as the system tick count and the extension “.log”. When a name is provided, it can be a fully qualified filename and path or just a filename. If only a filename is provided, the file will be created in the LegatoLogs folder. The name parameter is not a string literal and should be typed explicitly without quotes. Adding the word “robust” (not case-sensitive) to pragma will cause the log file to be flushed (opened and closed) on each message write. If the Legato engine should crash during an operation, the flush operation ensures that the last item will be written to the file. The robust mode then serves two purposes: all data is saved prior to the next instruction and it allows an application like Notepad.exe to read the log while the script is running. However, this comes at the price of significantly slowing down the script engine.
The Legato Error log will contain info about the creation of the log or an error message if the log cannot be created. That may be in the IDE or have to be retrieved by the caller or via other means.
Trace contents appear as follows:
Start Legato Trace Log at 2015-11-18T16:05:56  File: D:\Development\Applications\...
Script Engine Entry: (default)  Parent: MenuHook
Function Entry: main
    04C33B79      0 |  0   116 [ 1]  :: int main() {
    04C33B79      0 |  0   121 [ 1]  ::     s1 = GetScriptParent();
    04C33B79      0 |  0   122 [ 1]  ::     if (s1 == "LegatoIDE") {
    04C33B79      0 |  0   127 [ 1]  ::     return ERROR_NONE;
  returns int: 0 (0x00000000)
Script Engine Exit: 0x00000000
Caller Engine Entry: Menu Hook
Function Direct Entry: 130
  p-0 int    'f_id': 17006 (0x00000000)
  p-1 string 'mode': "preprocess"
    04C33B89     16 |  0   131 [ 1]  :: int run(int f_id, string mode) {
    04C33B89     16 |  0   145 [ 1]  ::     is_xfr_saved = false;
    04C33B89     16 |  0   146 [ 1]  ::     is_xfr = false;
    04C33B89     16 |  0   147 [ 1]  ::     fnXFRPath = "";
    04C33B89     16 |  0   148 [ 1]  ::     ArrayClear(files);
    04C33B89     16 |  0   149 [ 1]  ::     ArrayClear(pretypes);
    04C33B89     16 |  0   150 [ 1]  ::     riskreturn = false;
    04C33B98     31 |  0   151 [ 1]  ::     skip_cleanup = false;
The script engine startup will be the first entry normally followed by the “Script Engine Entry” which contains an optional entry point request and parent name (see the GetScriptParent function). “Caller Engine Entry” indicates a reentrant call external to the script engine, such as from a hook.
When a function is entered, the “Function Entry” log line will appear with the function name or line number. Line numbers are employed and cached for each hook entry for speedier program entry. In addition, if parameters are provided, they are logged as well. Note that the variable names associated with the parameters are not provided since they are technically provided in order and then placed into the functions local variable pool. Longer parameters values are truncated and control codes are replaced with ‘.’ characters.
Each line that is executed is logged prior to its actual execution. If execution results in one or more non-SDK functions being called, each function’s trace will appear. The log entry contains the following information:
Tick Time — The time, in hex, since the system started. The time gives a general indication of delays and when the script was called, for example from a hook. The time can also be used to get an idea of when functions are being called in concert with other scripts or background scripts.
File Index — Indicates which file within the program the line is being executed from. Zero (0) is the main file.
Line number — The line being executed.
Back Marker — a “^” character indicates that the execution moved up in the file, such as in a loop. Note that function calls do not impact the back marker.
Program Code — The program’s code, less comments.
Declarations are not reported in the trace.
When a function returns, a “returns” entry will be added with the data type and value. Again, large values are truncated and control codes are replaced with ‘.’ characters.
If the execution flow leaves the script engine, a “Script Engine Exit” or “Caller Engine Exit” will be added. Note that the hex code provided is the error state from the script engine itself. If an error occurs in the script code, the message might be something like this:
Function Entry: get_xfr_window
    04C34666   2797 |  0   619 [ 2]  :: handle get_xfr_window() {
    04C34666   2797 |  0   624 [ 2]  ::     hwXFR = GetActiveEditWindow("123");
  Caller Engine Exit: ERROR 0x808017B0
       Error Message: Unexpected extra parameter not allowed.
Page revised 2026-01-05
| Table of Contents | < < Previous | Next >> |
© 2012-2025 Novaworks, LLC. All rights reserved worldwide. Unauthorized use, duplication or transmission is prohibited by law. Portions of the software are protected by US Patents 10,095,672, 10,706,221 and 11,210,456. Novaworks, GoFiler™ and Legato™ are registered trademarks of Novaworks, LLC. EDGAR® is a federally registered trademark of the U.S. Securities and Exchange Commission. Novaworks is not affiliated with or approved by the U.S. Securities and Exchange Commission. All other trademarks are the property of their respective owners. Use of the features specified in this language are subject to terms, conditions and limitations of the Software License Agreement.